Paper Trader#
Welcome to the exciting world of paper trading with our platform! Once you’ve crafted your ideal portfolio, the adventure doesn’t end there – it’s time to bring your strategies to life with our dynamic paper trader feature. With just a click, you can set your portfolio in motion and watch it unfold in real-time. Our paper trader not only allows you to track your investments live but also keeps you in the loop with real-time notifications. Stay connected and informed as your portfolio evolves, making the most of every market move.
At-a-Glance Portfolio Overview#
At the top, take a quick peek into the structure of your portfolio, accompanied by key metrics for a swift and insightful overview.
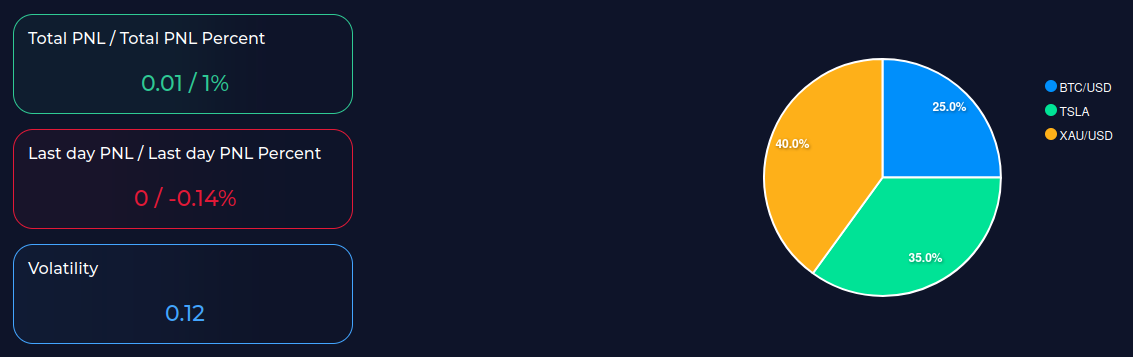
On the left side of the screen, the cards display key performance metrics of the paper trader: the total profit and loss (PNL) since inception, the PNL for the last day, and the volatility—a measure of risk (lower values indicate lower risk).
On the right side, two pie charts provide a visual representation of portfolio composition. The first chart shows the initial asset distribution at the time of portfolio creation, while the second chart reflects the current distribution, adjusted for the gains and losses of each asset.
Note
The color of the total PNL (Profit and Loss) and last day PNL boxes are dynamic and will be adjusted based on their value. When the PNL is positive, the box will be colored green, indicating a gain. Conversely, when PNL is negative, the box will be colored red, signaling a loss.
Tip
Volatility is a measure of risk and is calculated by getting the standard deviation of the return of the portfolio. The lower the volatility the lower the risk level of the portfolio!
Dive into Visuals#
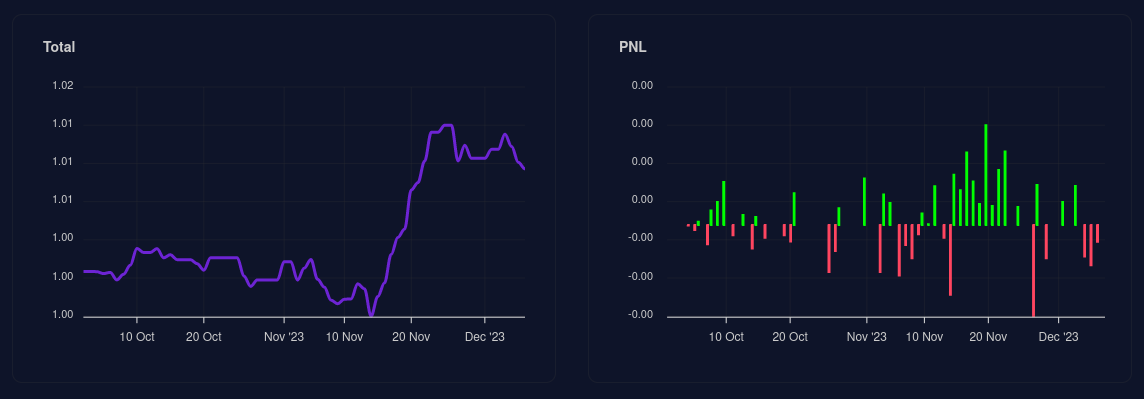
Get ready for a deeper understanding! Our visualizations provide a detailed look into your portfolio’s performance. On the left, track the flow of your portfolio value over time since the paper trader took the stage, broken down with daily granularity.
Over on the right, check the dynamic bar chart illustrating your daily profits and losses. Watch as winning trades light up in green, and losses are boldly marked in red. It’s a visual journey that adds a layer of insight to your trading experience.
Caution
Note that all the charts and results presented here are only for demonstration purposes and do no represent any actual performance of Eigen portfolios.
Take Control#
Empower yourself by staying on top of your open positions. Monitor the entry price, time, stop loss, and take profit – all at your fingertips. Feel the thrill of experimenting with your trading ideas by manually closing open positions.
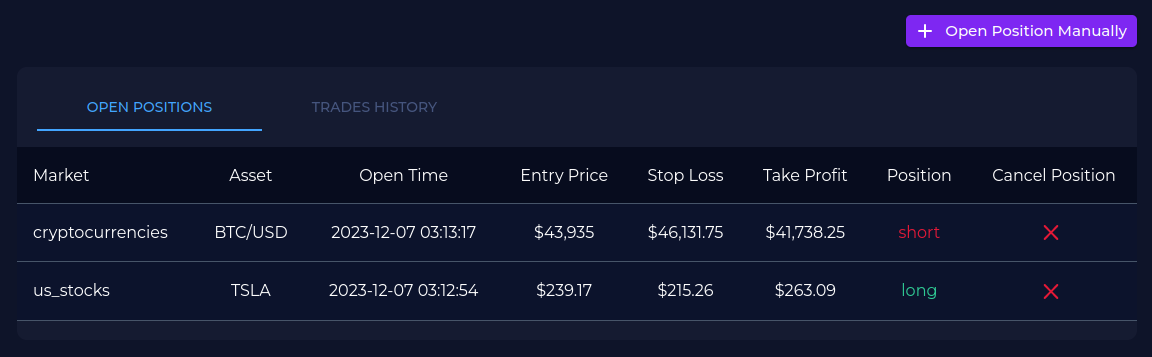
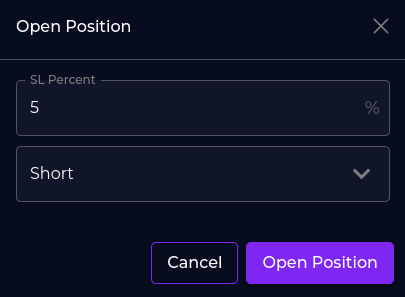
Moreover, you can also open positions manually for every asset that is not already in an open position.
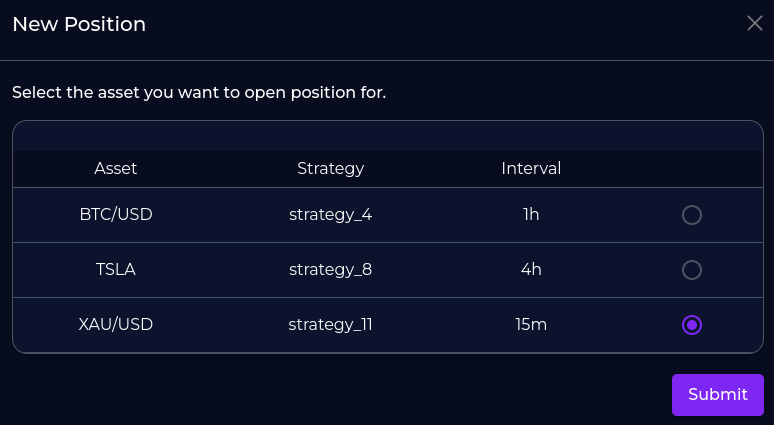
and set exit parameters by yourself. In the example provided below, the user is opening a SHORT position on the gold (XAU) with the current spot price of the market and sets stop loss and take profit at 5% of the entry price
Hint
Imagine a case where the asset price is at $100 and you want to open a new position manually with 5% stop loss, below you can find a simplke example of what would it mean in case of LONG / SHORT positions
LONG:
Stop Loss = 95
Take Profit = 105
SHORT:
Stop Loss = 105
Take Profit = 95
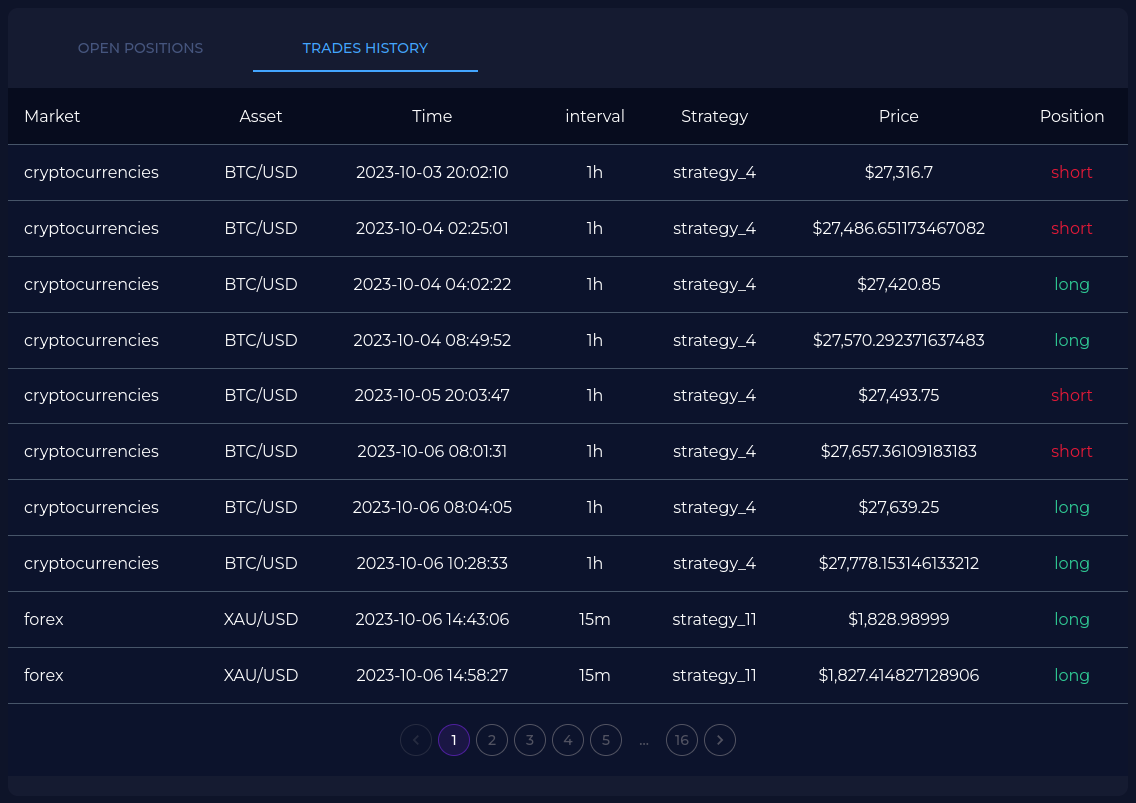
In another tab, you can go through all trades history and browse through every single trade that this paper trader has done, as well as some useful information including entry / exit time and price.