Daily Actions#
Current Daily Actions#
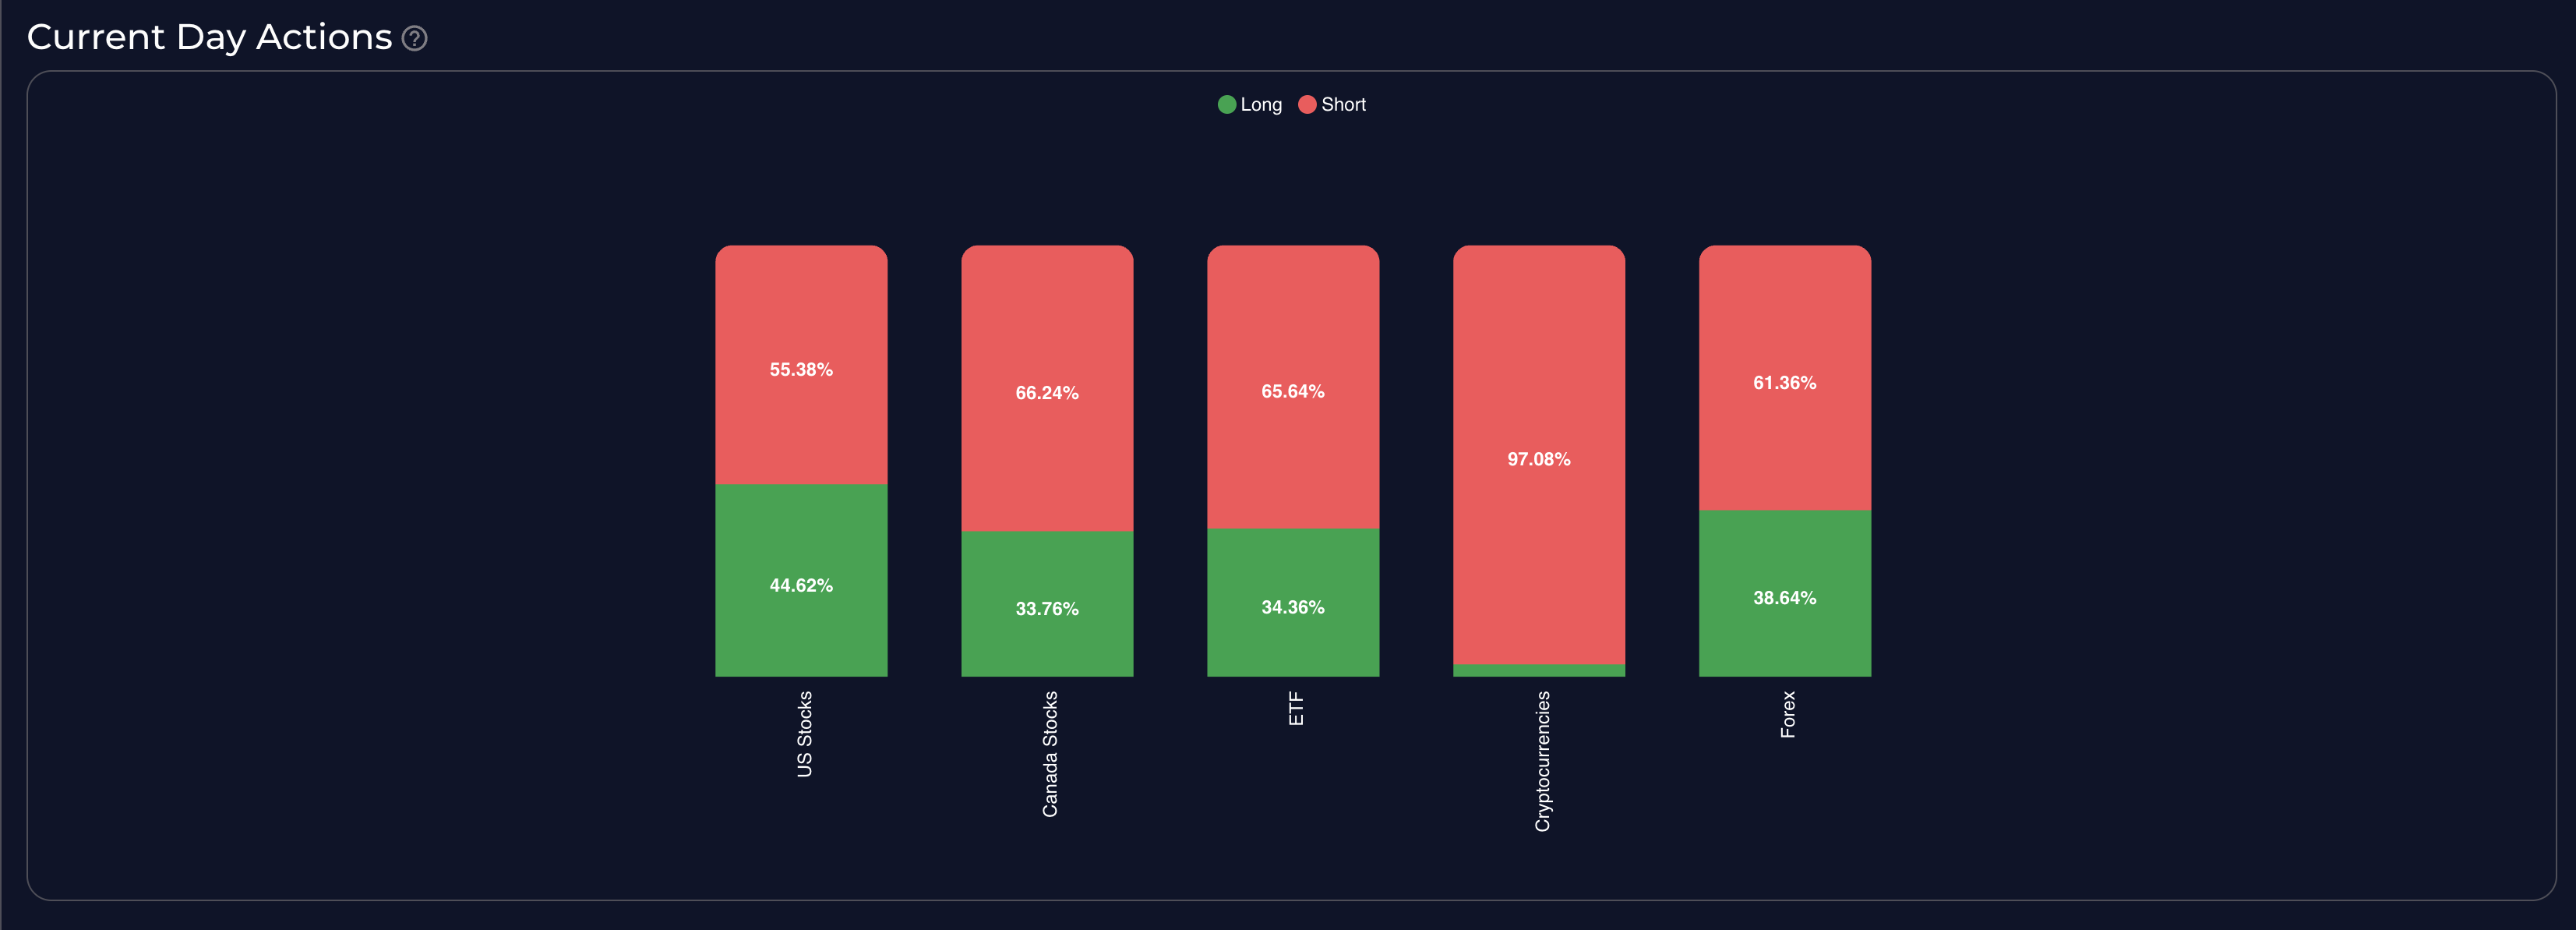
This section provides a comprehensive overview of all active strategies across all available assets in different markets on the last trading day.

For example, this plot indicates that on the last trading day for cryptocurrencies, more than 97% of all active (triggered) strategies suggest taking short positions in the market. This analysis suggests a strong bearish sentiment in the cryptocurrency market.
14-Day Actions Snapshot#
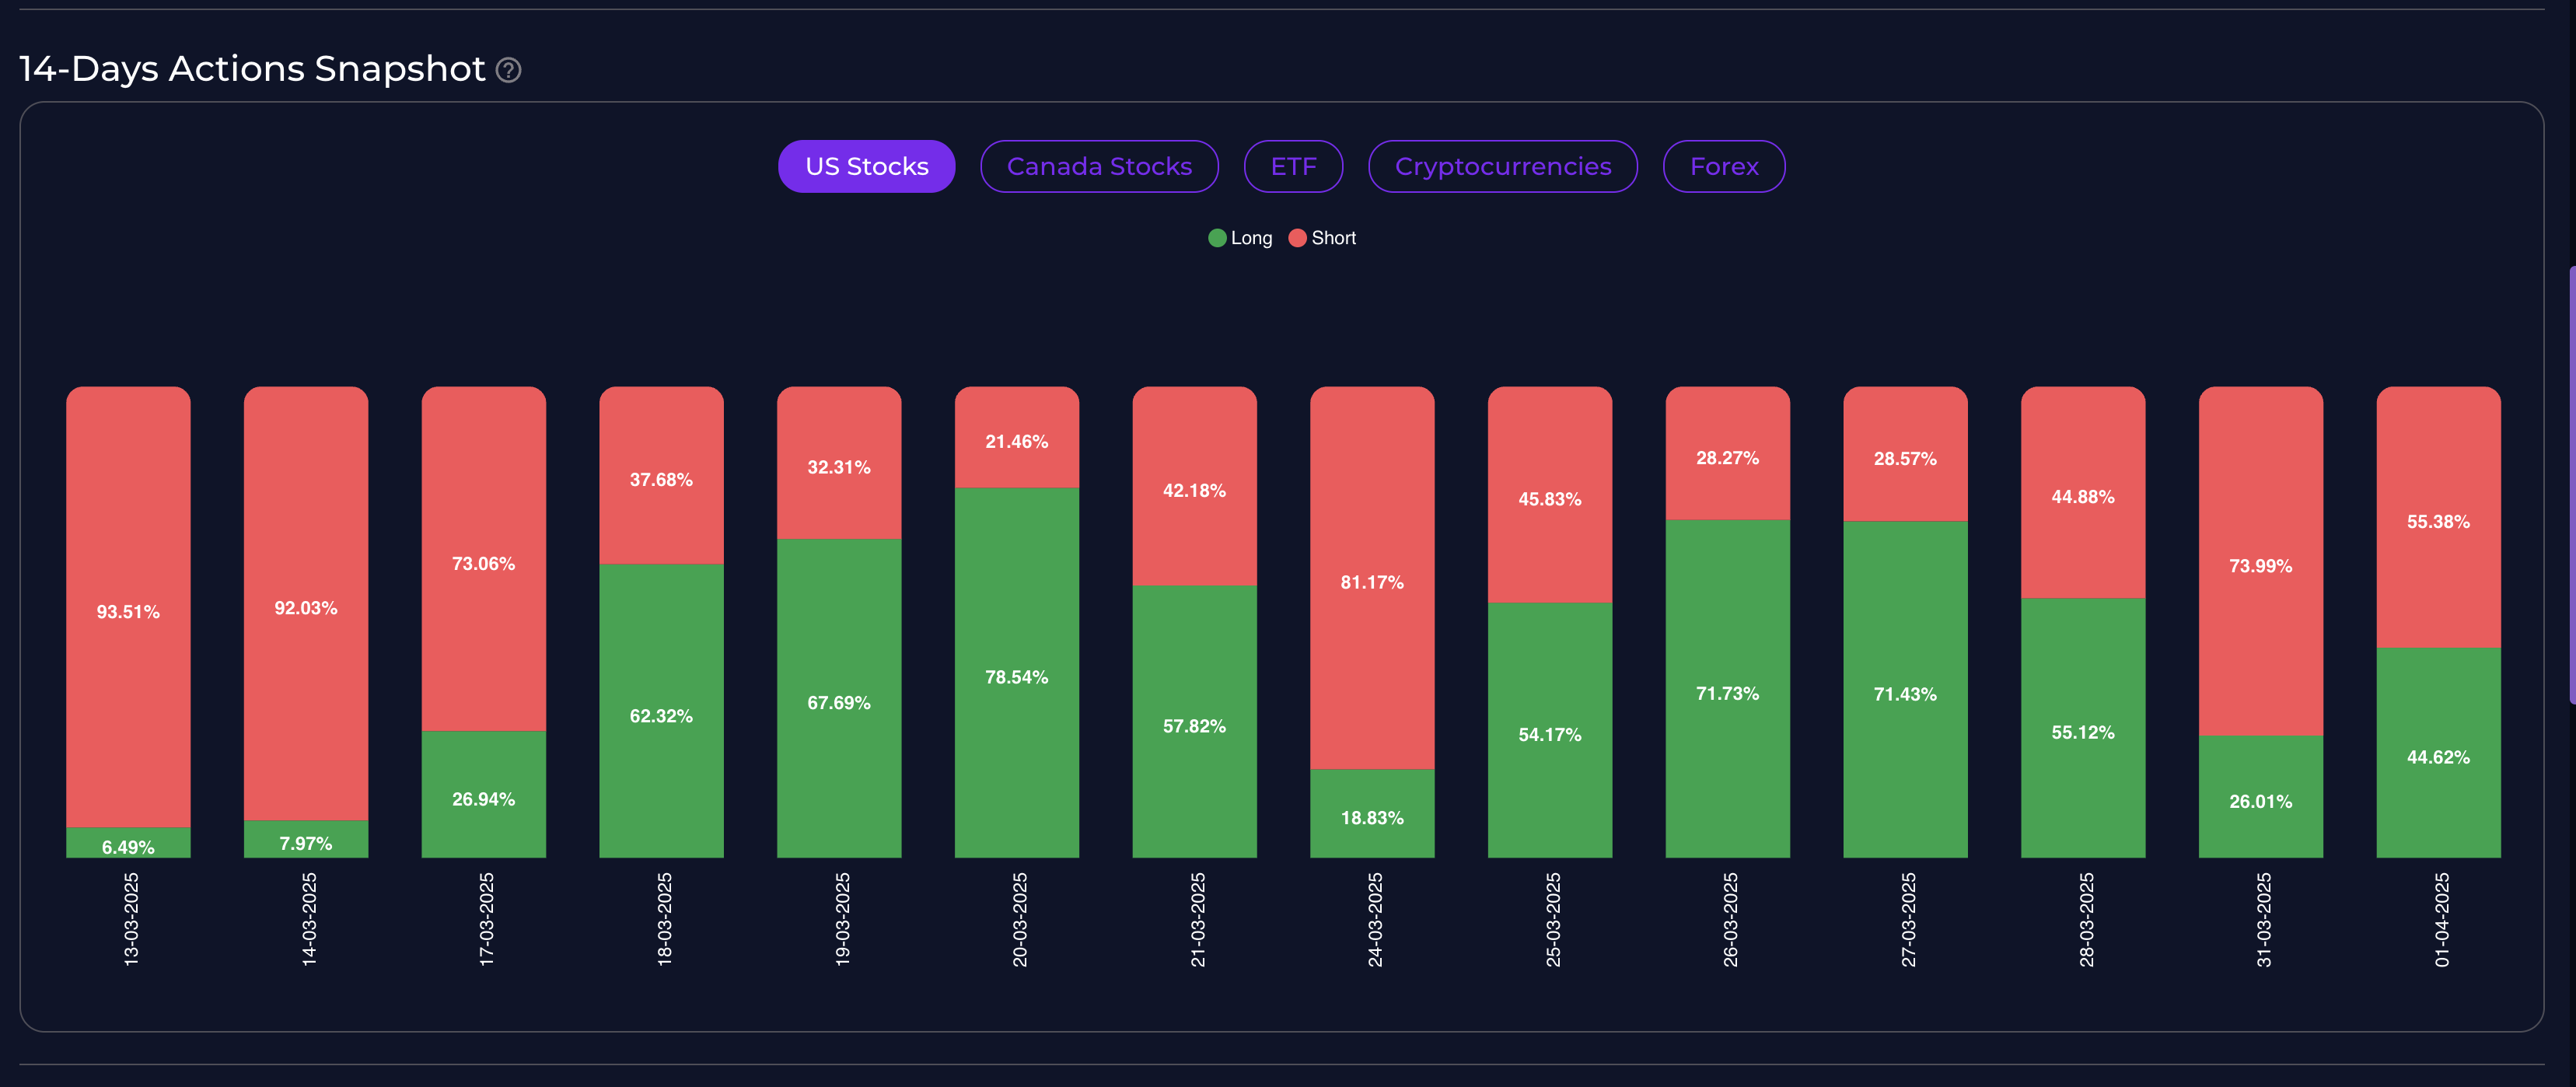
This section provides a comprehensive view of strategy performance and actions over the past two weeks, offering insights into longer-term market trends and strategy effectiveness.

For example, this plot shows the evolution of market sentiment over a two-week period. It reveals how the percentage of strategies suggesting long positions has gradually increased from 6% to over 44% in the US stocks market. This trend analysis helps identify sustained market movements and validate the strength of current market signals.
Top Active Assets#
This is a snapshot of our trading strategies for assets with the most actions in every market.

For example, in the US market, the number “5” next to the TXT symbol indicates that 5 out of 25 strategies (20%) are signaling a potential price decline. Since TXT has the highest number of triggered strategies in the US market, this suggests a strong likelihood of downward price movement for this stock.
Current Actions in Details#
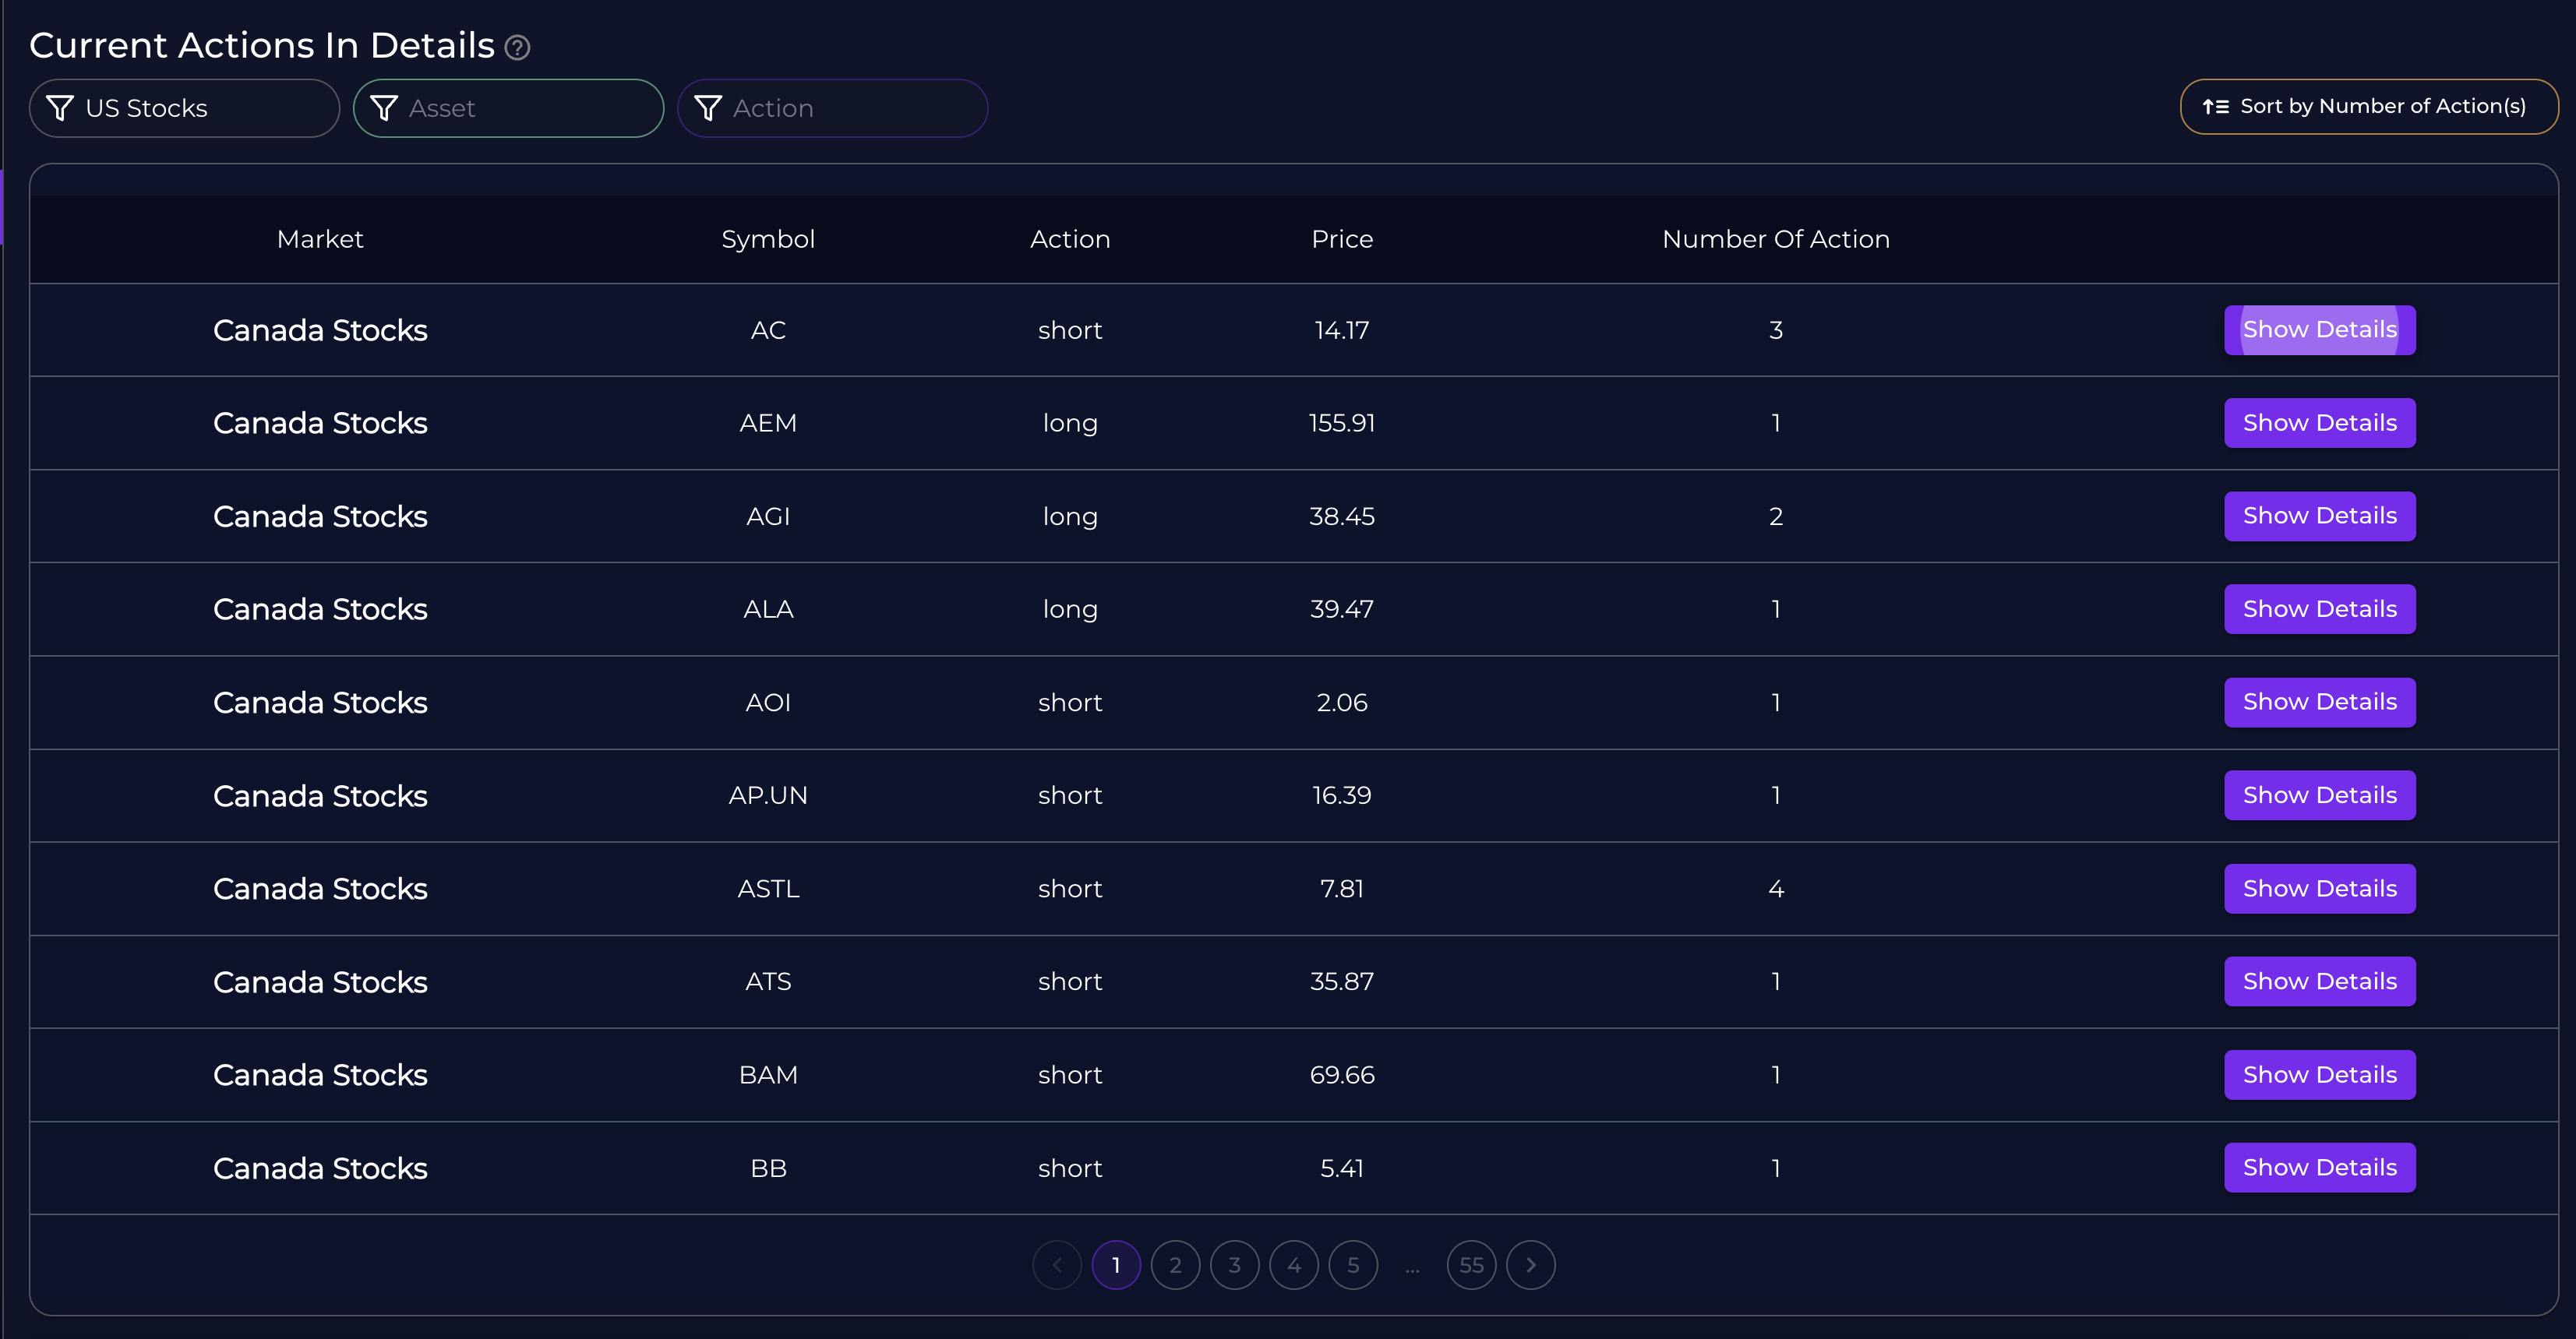
This table provides a comprehensive list of all active strategies across different markets and assets for the current trading day. It includes detailed information about each triggered strategy, including performance metrics and risk analysis.

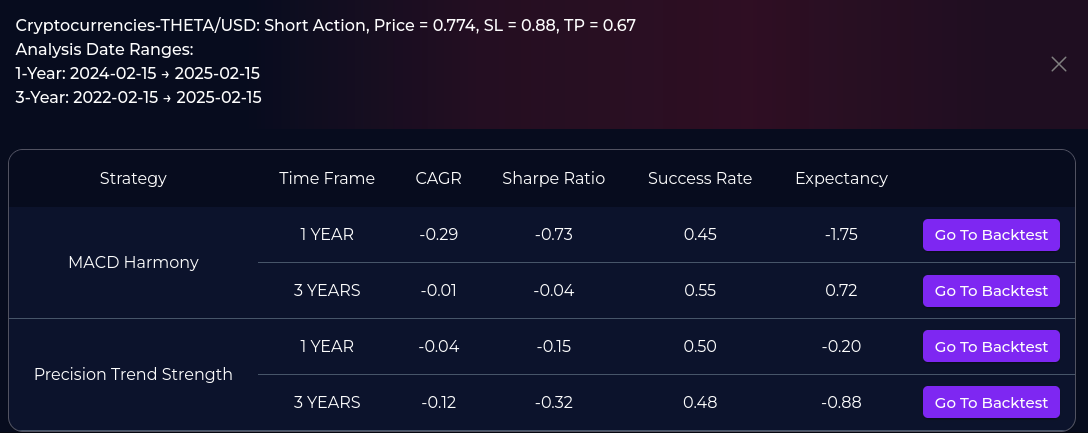
The table features advanced filtering and search capabilities, allowing you to easily locate specific information about strategies, markets, or assets. Each row includes a “Show Details” button that opens a new window displaying the backtest results for that specific strategy over the last one to three years. For even more comprehensive analysis, you can click the “Go to Backtest” button to access detailed statistics, performance metrics, and in-depth analysis of the strategy’s historical performance.
