
Backtest#
This feature involves applying a proposed trading algorithm to historical market data, enabling users to simulate and assess how their strategies would have performed in past market conditions. The software conducts a comprehensive analysis of both performance metrics and risk metrics, offering detailed charts and visuals to provide a holistic view of strategy outcomes.
Initial Parameters#
To get started, you’ll need to set some initial parameters, which can be easily found on the right sidebar of the page. The required parameters include:
1. Market#
The market you’re interested in. The full list can be found in Available Markets.
Important
Unlock diverse market possibilities based on your account tier! For a clear breakdown of the markets you can access, hop over to our pricing page.
2. Asset#
Once you have selected the market, you will have access to a comprehensive list of supported assets within that market.
If you already know the name of a specific asset you are interested in, you have the option to use the search functionality to quickly locate and select that asset.
3. Interval#
15 minutes
1 hour
4 hours
1 day
So far its just like the parameters that we also had in the live strategies page, but the backtest feature is meant for a way more in depth overview, so we still need to set a couple more parameters.
Tip
Each field in the form is accompanied by a question mark, offering a brief summary to guide you on the purpose of that specific field.
4. Strategy#
Select from the range of strategies available at your subscription level to run the backtest.
Note
Newbie: 10 technical analysis strategies.
Pro: 25 technical analysis strategies.
Legend: Unlocks everything in the Pro tier and access to advanced machine learning algorithms for trend forecasting.
5. Time Window#
Choose the start and end time for your backtest analysis in the date picker window or simply enter the start and end dates in the provided fields.
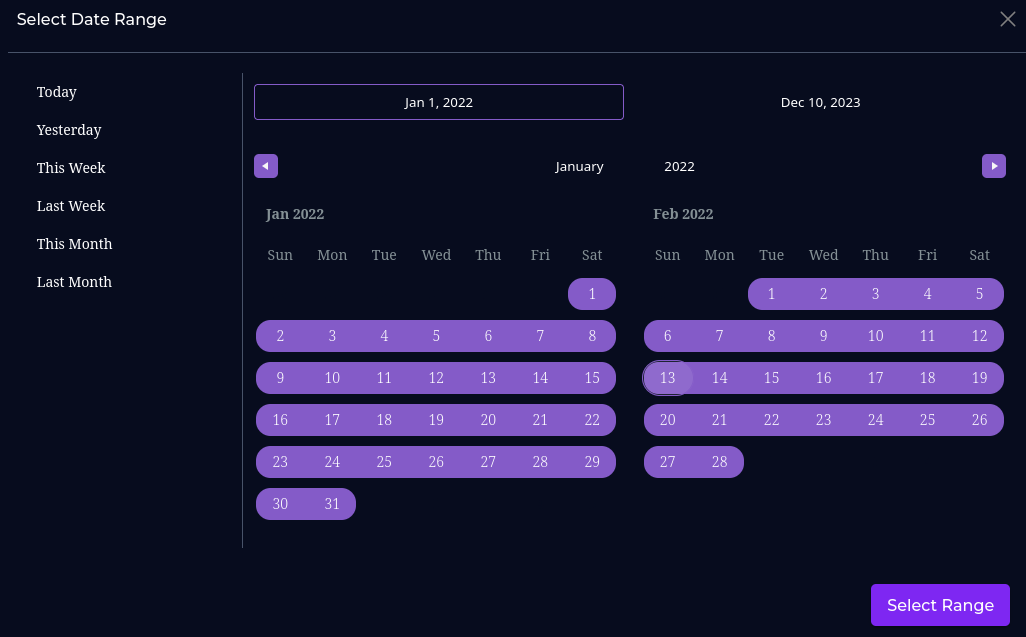
Note
Number of data points vary depending on the access level and latest allowed date will be determined based on user’s subscription plan and the chosen interval!
6. Trading Volume#
Reflects the imagined initial trade volume in USD, used in the backtest analysis.
7. Reward to Risk Ratio#
The potential profit against the potential loss. Default is one but can be changed to both less than or more than one. In case of the backtest parameters, it is quantized using
Tip
reward to risk ratio = \( \frac{|\text{Take Profit} - \text{Entry Price}|}{|\text{Stop Loss} - \text{Entry Price}|} \)
Let’s break down what the reward-to-risk ratio means when it is greater than 1 and when it is less than 1:
Reward-to-Risk Ratio Greater Than 1#
This means the potential reward is larger than the potential risk. In other words, the profit you’re aiming for (take profit) is greater than what you’re willing to lose (stop loss).
Example:
Entry Price: $100
Take Profit: \(120 (reward = \)20)
Stop Loss: \(95 (risk = \)5)
A ratio greater than 1 (like 4:1) means you’re targeting 4 times more profit than what you are risking. This is a favorable ratio, as it suggests that for every $1 of risk, you stand to gain $4.
What it means:
Greater than 1 → Higher reward for each unit of risk.
Traders generally prefer a reward-to-risk ratio greater than 1 because it means the potential profit outweighs the possible loss.
Reward-to-Risk Ratio Less Than 1#
This means the potential reward is smaller than the potential risk. In this case, the take profit is lower than what you stand to lose based on the stop loss. If the ratio drops below 1, like 0.5, you would be risking twice as much as the potential gain. For instance:
Example:
Entry Price: $100
Take Profit: \(105 (reward = \)5)
Stop Loss: \(90 (risk = \)10)
What it means:
Less than 1 → You’re risking more than what you expect to gain.
Most traders try to avoid trades where the reward-to-risk ratio is less than 1, as it implies you could lose more than you could profit. In these cases, you need a much higher win rate to be profitable.
Hint
Imagine the reward-to-risk ratio in a trade like deciding if the pizza you’re about to order is worth the price. It’s a way of looking at how much profit you could make compared to the potential loss. Picture it as making sure you get a delicious pizza for the money you’re spending – you want the tasty reward to be worth the cost of the cheesy risk! Similarly, in trading, a good reward-to-risk ratio helps ensure your potential gains make taking a chance on a trade worthwhile. It’s all about making sure your trading decisions are as satisfying as a slice of your favorite pizza!
8. Trade Mode#
Can be margin or spot, where margin trades with both LONG and SHORT positions,
while spot only trades LONG positions.
Trading modes are explained in further details in Algorithmic Trading Entry Point Section
9. Dynamic Trade#
In Eigen FinTech, a “dynamic trade” refers to the process of adjusting your trade volume based on the outcome of previous trades. This means that after each trade, you reinvest your profits or losses into the next one, allowing your position size to grow or shrink accordingly. If this feature is turned off, your trade volume remains constant throughout all trades, regardless of past performance.
10. Trend Integration#
ML models are used to analyze the trend of the asset and provide a more accurate prediction of future price movements. This feature is available only for the Legend subscription plan. It will integrate the trend forecast with technical analysis strategies to enhance the overall performance of the backtest.
Results#
After you’ve configured and set the initial parameters, the algorithm will execute based on your specified conditions. This might take a few seconds as a substantial amount of data is being processed, so thank you in advance for your patience.
Once the analysis is done, the platform offers you insights and performance results. This encompasses a wide range of metrics and a chart, delivering a comprehensive overview of the analyzed asset.
Metrics#
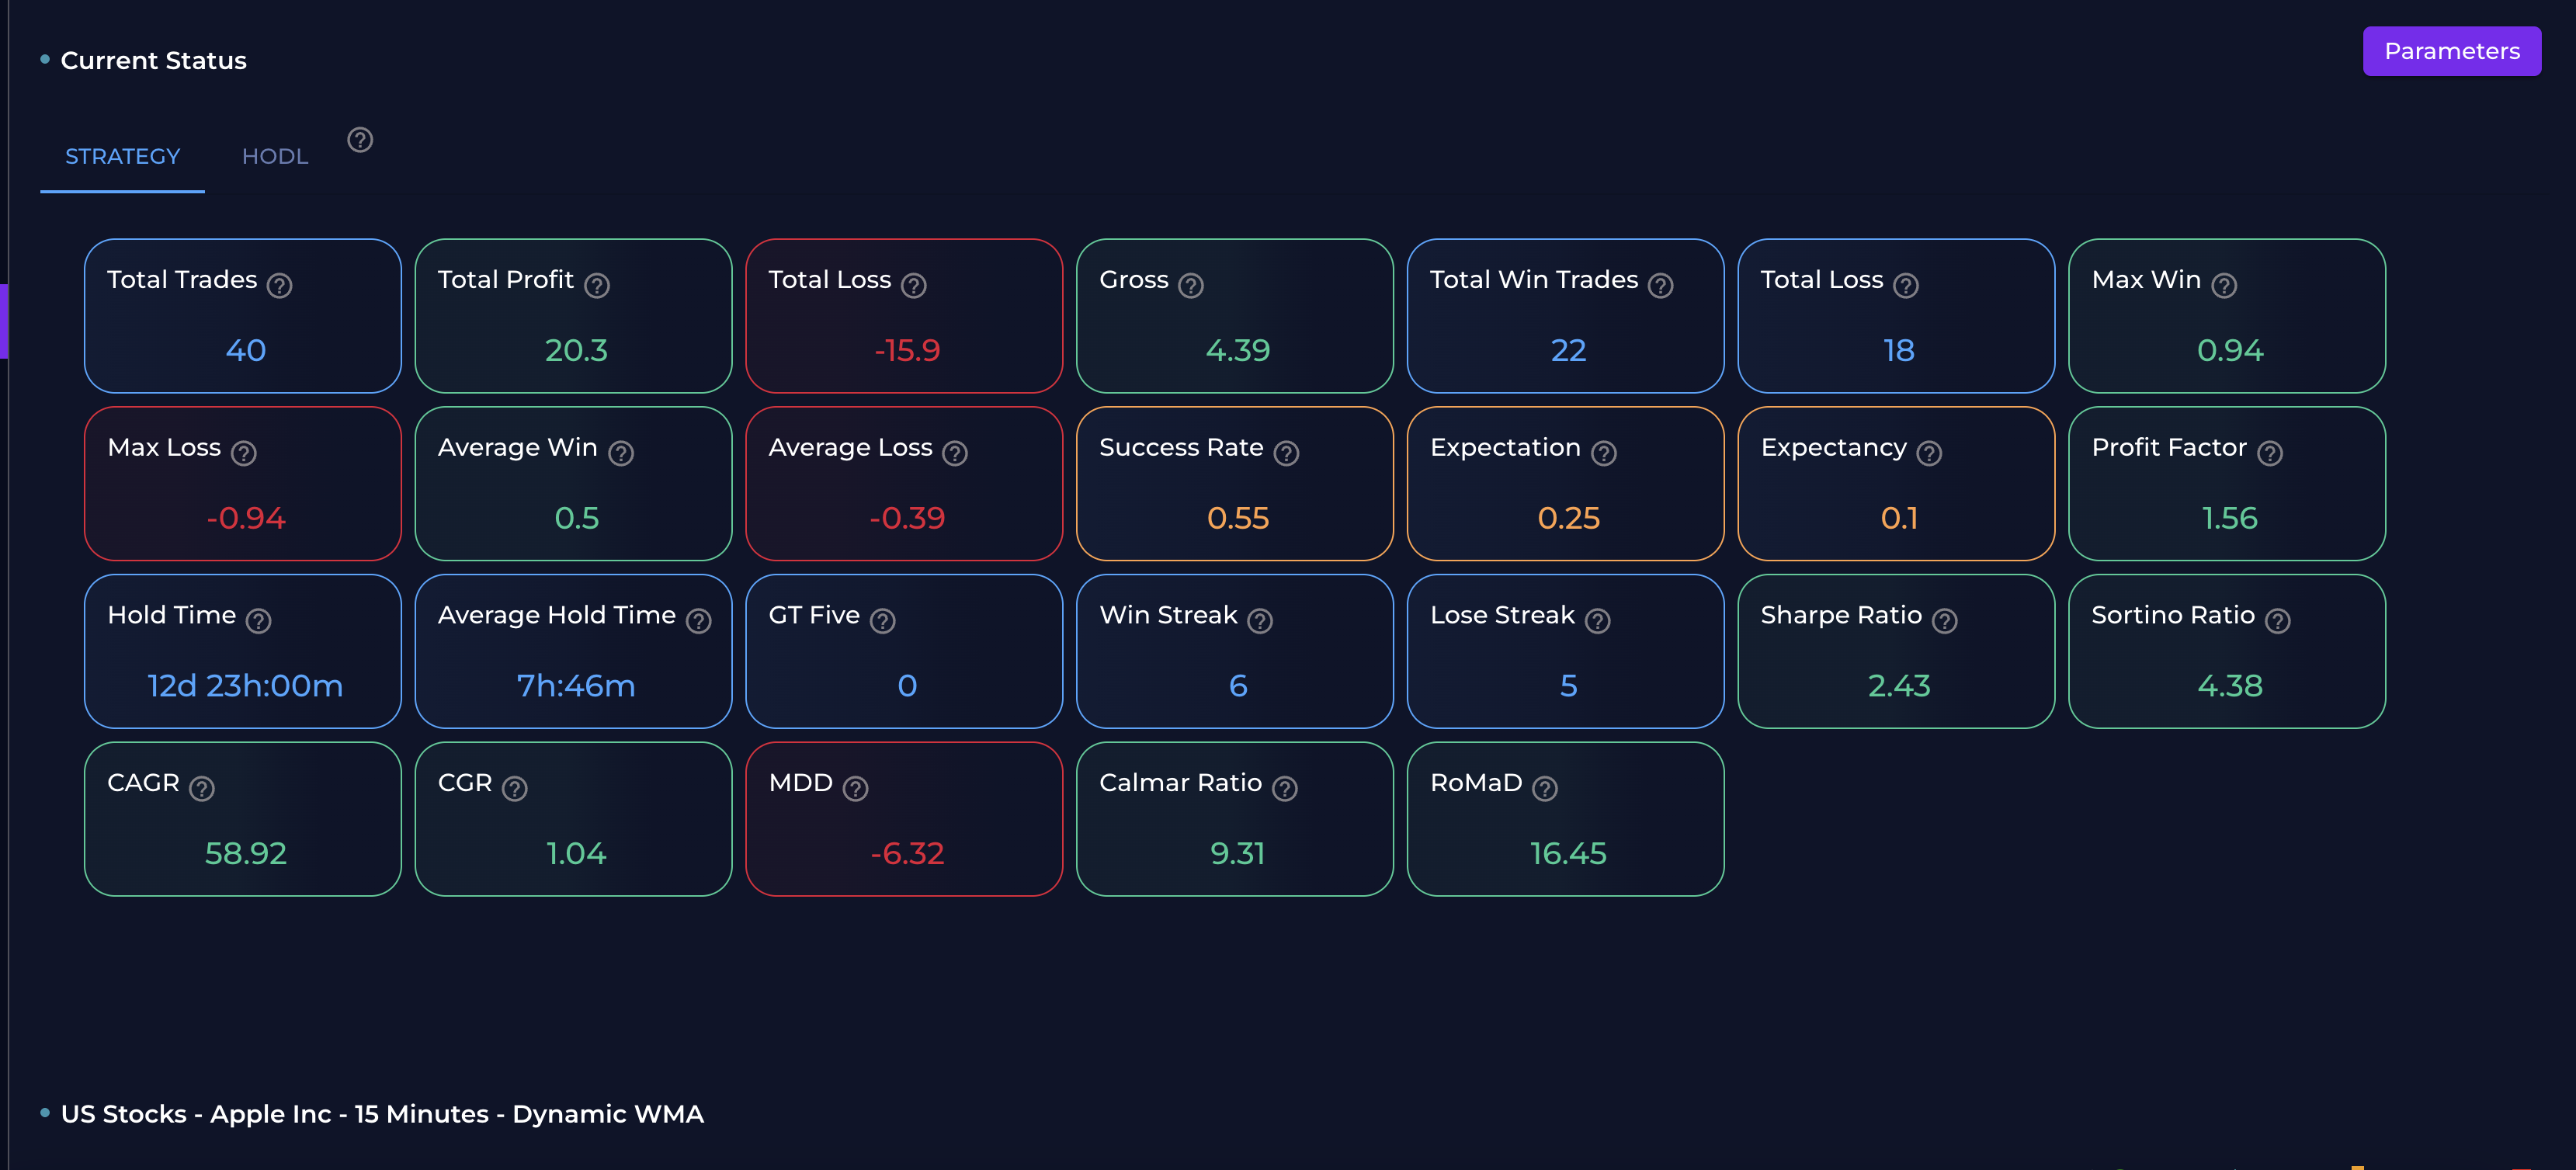
Total Trades: Total number of trades done during the given period.
Total Profit: Sum of all profits from trades in USD
Total Loss: Sum of all losses from trades in USD
Gross Profit/Loss: Total Profit + Total Loss
Total Win Trades: Number of winning trades
Total Loss Trades: Number of losing trades
Maximum Win: Largest profit in USD
Maximum Loss: Largest loss in USD
Average Win: Average profit from trades in USD
Average Loss: Average loss from trades in USD
Success Rate: Number of wining trades divided by total number of trades
Expectation: Robustness of strategy! Greater than 0.5 shows higher robustness associated with a change in the loss
Expectancy: Tells you what you can “expect” to earn or lose from the next trade based on the trading history.
Profit Factor: Potential to be profitable! Larger than one is profitable and lower than one is not profitable
Hold Time: Total amount of time being in an open position.
Average Hold Time: Total hold time divided by total number of trades.
GT Five: Number of trades with greater than 5% profit.
Win Streak: The biggest number of consecutive winning trades
Lose Streak: The biggest number of consecutive losing trades
Sharp ratio: Measures vestment returns relative to its risk.
Sortino ratio: Assesses investment return, emphasizing the downside risk.
CAGR: Mean annual growth rate of an investment over a specified period
CGR: Total growth achieved over a specific period
MDD: Maximum Drawdown, the largest peak-to-trough decline in the value of a portfolio during a specific period. It represents the worst possible loss an investor could have experienced if they bought at the peak and sold at the trough.
Calmar Ratio: A risk-adjusted performance metric that compares the annualized return to the maximum drawdown. It’s calculated as the ratio of the annualized return to the maximum drawdown over a specified period. A higher Calmar ratio indicates better risk-adjusted returns.
RoMaD: Return over Maximum Drawdown, a risk-adjusted performance measure that compares the total return to the maximum drawdown. It’s calculated as the ratio of the total return to the maximum drawdown. A higher RoMaD indicates better performance relative to the risk taken.
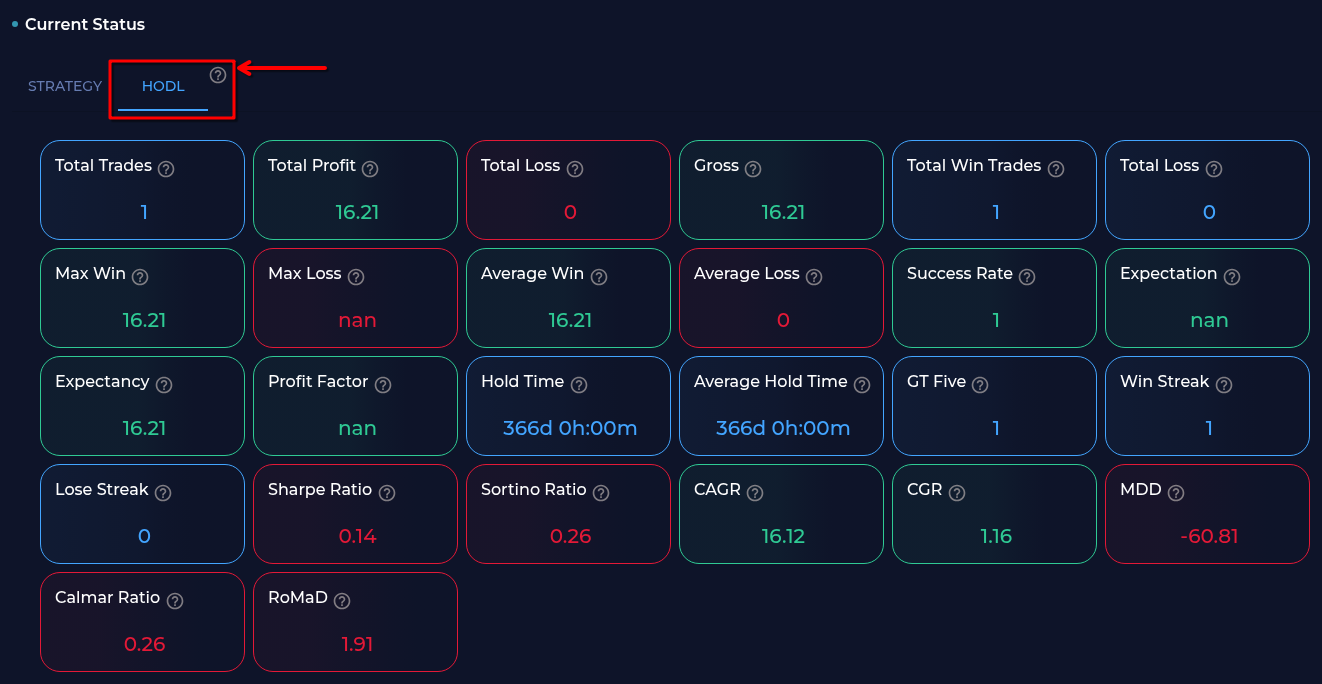
Tip
All performance metrics can be copared to a HODL strategy, which serves as a benchmark. The HOLD strategy represents a simple buy-and-hold approach where an asset is purchased at the beginning of the period and held until the end. This comparison helps evaluate whether your strategy adds value beyond a passive investment approach, considering the same time period and market conditions.
The HODL strategy metrics can be found on top of metrics:
Note
Calculating Sharpe and Sortino Ratios
After calculating monthly returns, suppose the returns for N months are represented as 𝑟₁, 𝑟₂, … , 𝑟ₙ. Follow these steps:
Gross (Cumulative) Return:
\[ Rₜ = \prod_{i=1}^{t} (1 + rᵢ), \quad t = 1, 2, … , N \]Effective Rate of Interest (Inner Annualized Return):
\[ rₑ = (Rₙ)^{\frac{12}{N}} - 1 \]Sharpe Ratio:
\[ \text{Sharpe Ratio} = \frac{rₑ - r_f}{σ\sqrt{12}} \]Sortino Ratio:
\[ \text{Sortino Ratio} = \frac{rₑ - r_f}{σ_d\sqrt{12}} \]Where:
r_f is the risk-free rate
σ is the standard deviation of monthly returns
σ_d is the downside risk calculated as:
\[ σ_d = \sqrt{\frac{1}{N} \sum_{j=1}^{N} (r_j^-)^2} \]where \(r_j^-\) are the negative returns.
Source: Investopedia - Downside Risk
Calculating Profit Factor
Components:
Average Win Size: Average profit from winning trades.
Winning Rate: Probability of profitable trades.
Average Loss Size: Average loss from losing trades.
Loss Rate: Probability of losing trades, calculated as (1 - Winning Rate).
Calculating Expectancy
Source: Investopedia - Profit Factor and Expectancy
Calculating Expectation
Source: NetPicks - Profit Factor Expectancy
Calculating Maximum Drawdown (MDD)
Maximum Drawdown is calculated as the largest percentage drop from a peak to a trough in the portfolio’s value. Here’s how it’s computed:
Calculate Cumulative Returns: $\( R_t = \prod_{i=1}^{t} (1 + r_i), \quad t = 1, 2, \ldots, N \)$
Find Peak Values: $\( P_t = \max(R_1, R_2, \ldots, R_t) \)$
Calculate Drawdowns: $\( D_t = \frac{P_t - R_t}{P_t} \)$
Maximum Drawdown: $\( \text{MDD} = \max(D_1, D_2, \ldots, D_N) \)$
Calculating Calmar Ratio
The Calmar Ratio is calculated as the ratio of the annualized return to the maximum drawdown:
Where:
Annualized Return is calculated using the CAGR formula: $\( \text{Annualized Return} = \left(\frac{\text{Ending Value}}{\text{Beginning Value}}\right)^{\frac{1}{\text{Years}}} - 1 \)$
Maximum Drawdown is calculated as shown above
A higher Calmar Ratio indicates better risk-adjusted returns, as it shows how much return is generated per unit of maximum drawdown.
Calculating Return over Maximum Drawdown (RoMaD)
RoMaD is calculated as the ratio of the total return to the maximum drawdown:
Where:
Total Return is the cumulative return over the period: $\( \text{Total Return} = \frac{\text{Ending Value} - \text{Beginning Value}}{\text{Beginning Value}} \)$
Maximum Drawdown is calculated as shown above
A higher RoMaD indicates better performance relative to the risk taken, as it shows how much return is generated per unit of maximum drawdown.
Calculating Compound Annual Growth Rate (CAGR)
CAGR is calculated as:
Where:
Ending Value is the final portfolio value
Beginning Value is the initial portfolio value
Years is the number of years in the investment period
CAGR provides a smoothed annual rate of return, assuming the investment grows at a steady rate.
Calculating Cumulative Growth Rate (CGR)
CGR is calculated as:
This represents the total percentage growth over the entire period, regardless of the time taken to achieve it.
Chart#
The chart showcases the Open, High, Low,
Close (OHLC) candlestick prices of the selected asset within the specified time window.
Additionally, it visually represents the triggers for both LONG and SHORT positions,
along with their corresponding stop-loss and take-profit levels.
Here’s an illustration of the initial parameters configured for Apple US Stock, covering the period from March 2025 to April 2025, with 15-mins interval trading, margin mode, and dynamic trade. The starting point is a $100 trading volume, resulting in the displayed metrics and the generated chart.
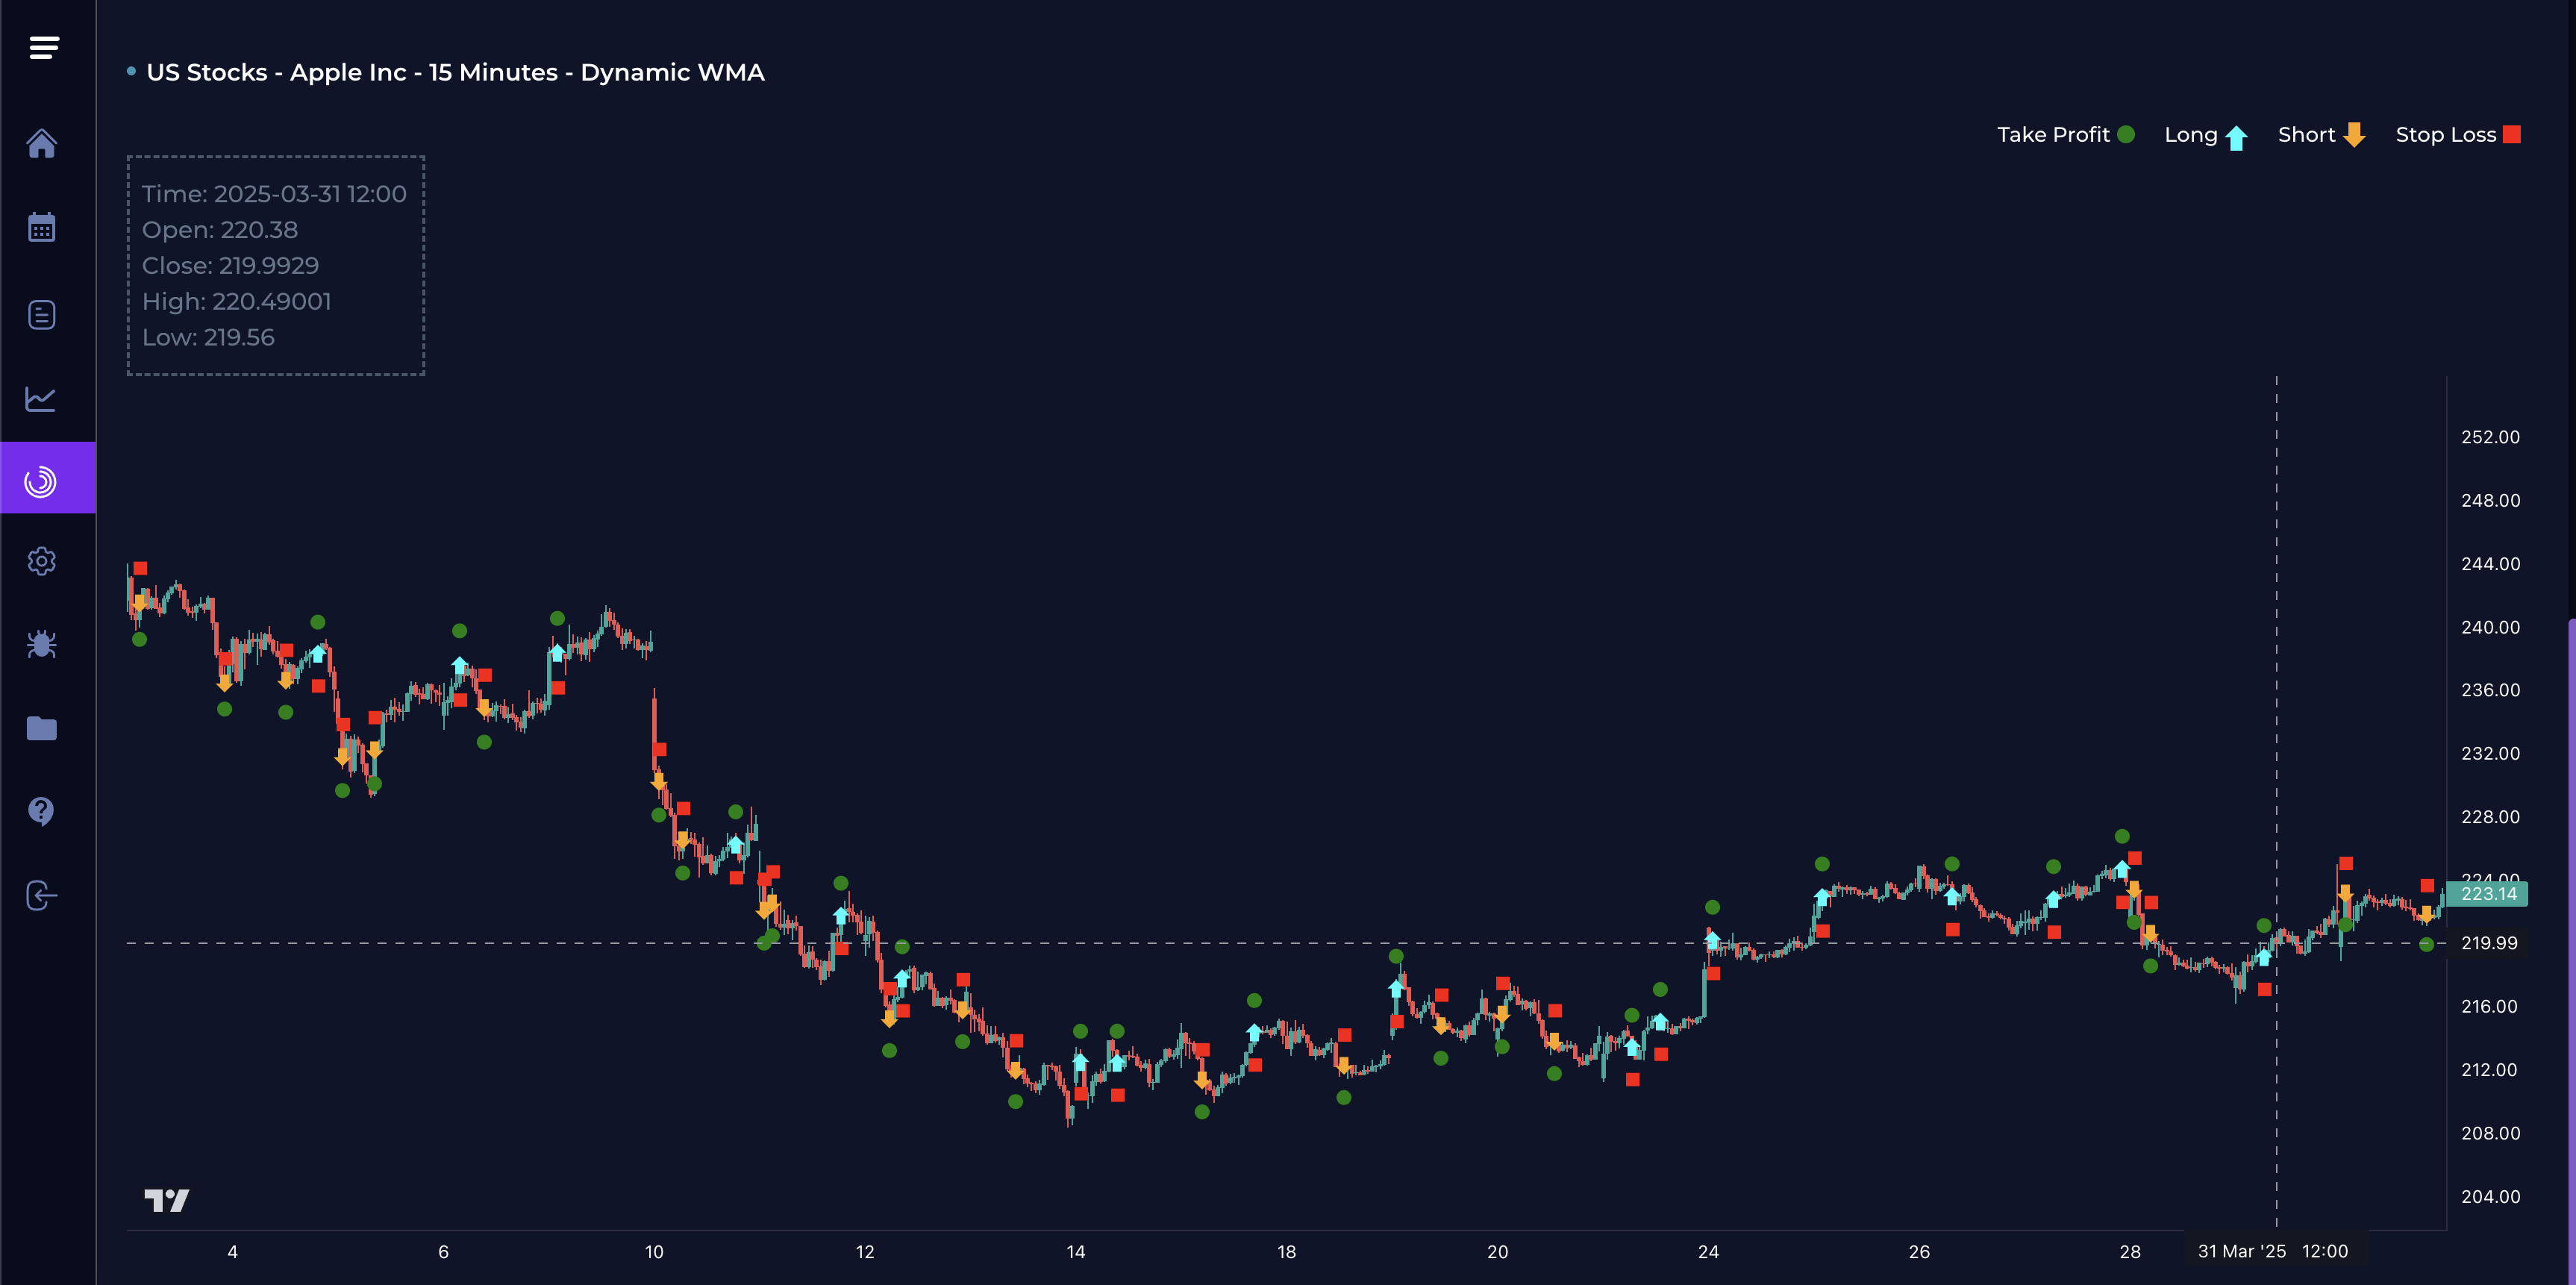
Tip
Dive deeper into specific parts of the graph by zooming in for a closer look. Alternatively, hover your mouse cursor over the chart to access real-time interactive information.
Important
If you notice any discrepancy between live strategies and backtest signals, the main reason is that, during backtesting, when an open position exists and the algorithm generates another signal for the same position, the backtest disregards the second signal. However, in live strategies, since we do not consider closing positions, all signals from each strategy are displayed.