
Live Strategies#
The Live Strategies page allows you to track the performance of technical analysis strategies in real-time for different assets and time intervals.
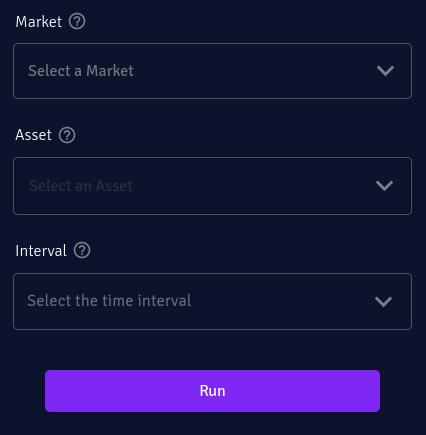
Initial Parameters#
To get started, you’ll need to set some initial parameters, which can be easily found on the right sidebar of the page. The required parameters include:
1. Market#
The market you’re interested in. The full list can be found in Available Markets.
2. Asset#
Once you have selected the market, you will have access to a comprehensive list of supported assets within that market.
If you already know the name of a specific asset you are interested in, you have the option to use the search functionality to quickly locate and select that asset.
3. Interval#
15 minutes
1 hour
4 hours
1 day
Results#
Once you have configured and set all the initial parameters, the EigenFinTech platform will execute all the available technical analysis strategies (which may vary depending on your subscription plan) on the selected asset and interval. The analysis will be performed on the last month of data, regardless of the trading interval you have selected. This provides a consistent timeframe for analysis across all intervals, making it easier to compare strategies and market conditions.
Upon completion of the analysis, the platform presents you with insights and performance results. This includes a set of metrics, a table, and a chart that provide a comprehensive overview of the analyzed asset and its technical analysis strategies.
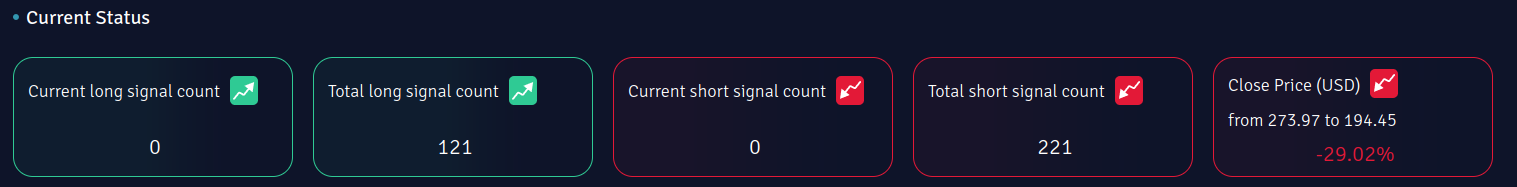
Metrics#
Presented in color-coded cards, designed to offer quick and easily interpretable insights.
Current Long Signal Count: Number of strategies that are currently recommending a LONG position.
Total Long Signal Count: Total number of LONG signals from all strategies in the recent data points.
Current Short Signal Count: Number of strategies that are currently recommending a SHORT position.
Total Short Signal Count: Total number of SHORT signals from all strategies in the recent data points.
Price Change: Price change of the chosen asset in the recent data points
Note
The color of the Price Change box is dynamic and adjusts based on the value of the price change. When the price change is positive, the box will be colored green, indicating a gain. Conversely, when the price change is negative, the box will be colored red, signaling a loss. This dynamic color scheme helps provide a quick visual indication of the direction of the price change.
Table#
The table displays a comprehensive breakdown of the performance for each strategy, offering the following information:
Signal: Current signal of the strategy can be LONG, SHORT, or N/A
Long Count: Number of the Long signals for the strategy in the recent data points
Short Count: Number of the Short signals for the strategy in the recent data points
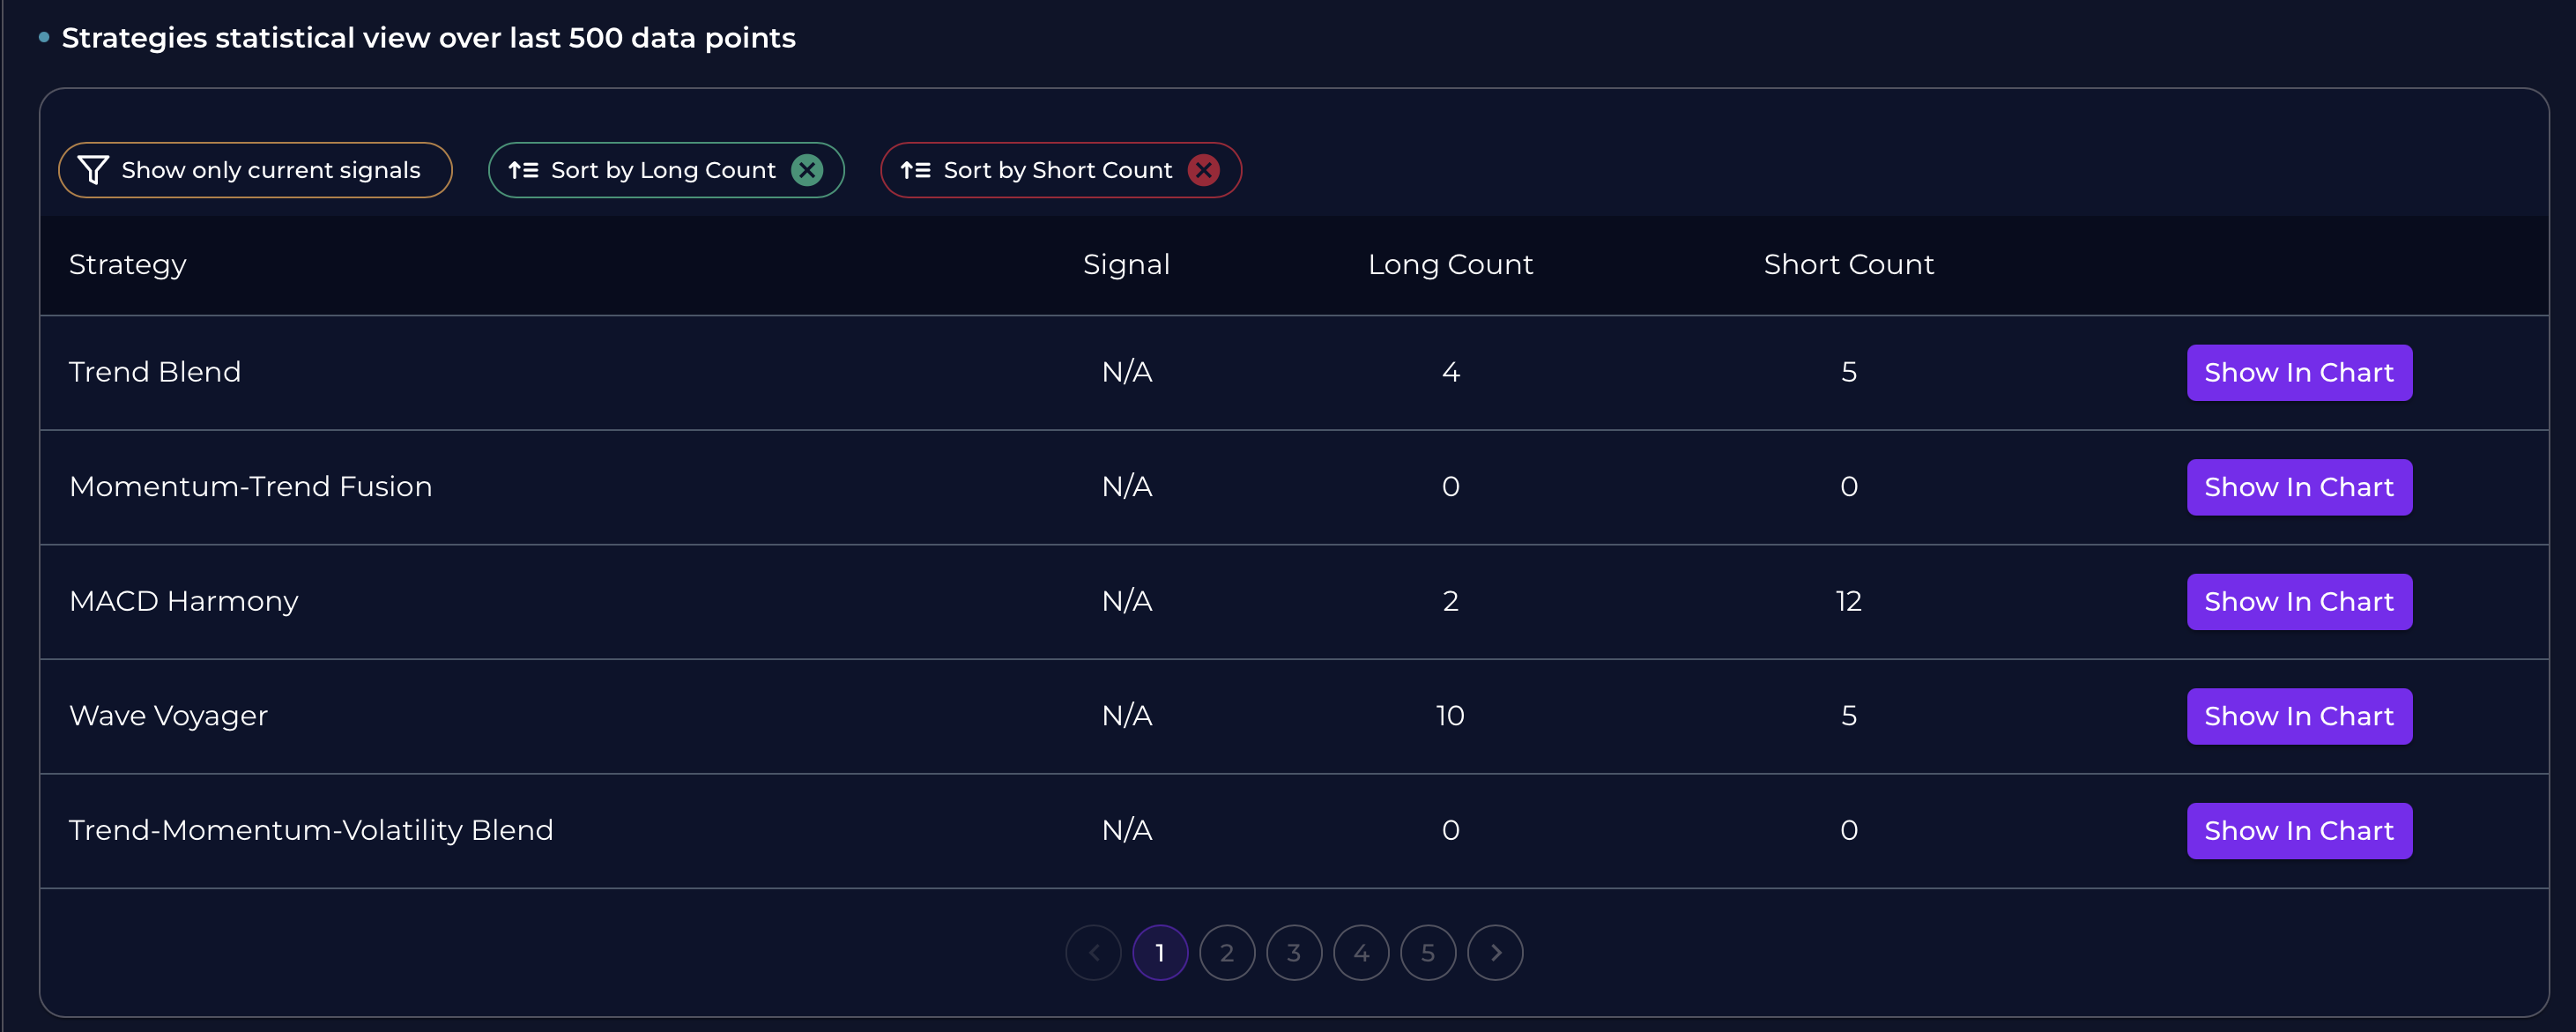
Here are descriptions for the buttons over the table:
Show Only Current Signals: This button filters the table to display only the strategies that currently have active signals. By clicking this button, you can focus on the strategies that are currently generating trading signals, making it easier to identify actionable opportunities.
Sort by Long Count: This button sorts the strategies in the table based on the number of long signals (buy signals) they have generated, in descending order. Clicking this button will rearrange the strategies to show those with the highest long count at the top, helping users to quickly identify the most bullish strategies.
Sort by Short Count: This button sorts the strategies in the table according to the number of short signals (sell signals) they have produced, also in descending order. When this button is clicked, the strategies with the most short signals will be listed first, allowing users to easily identify the most bearish strategies.
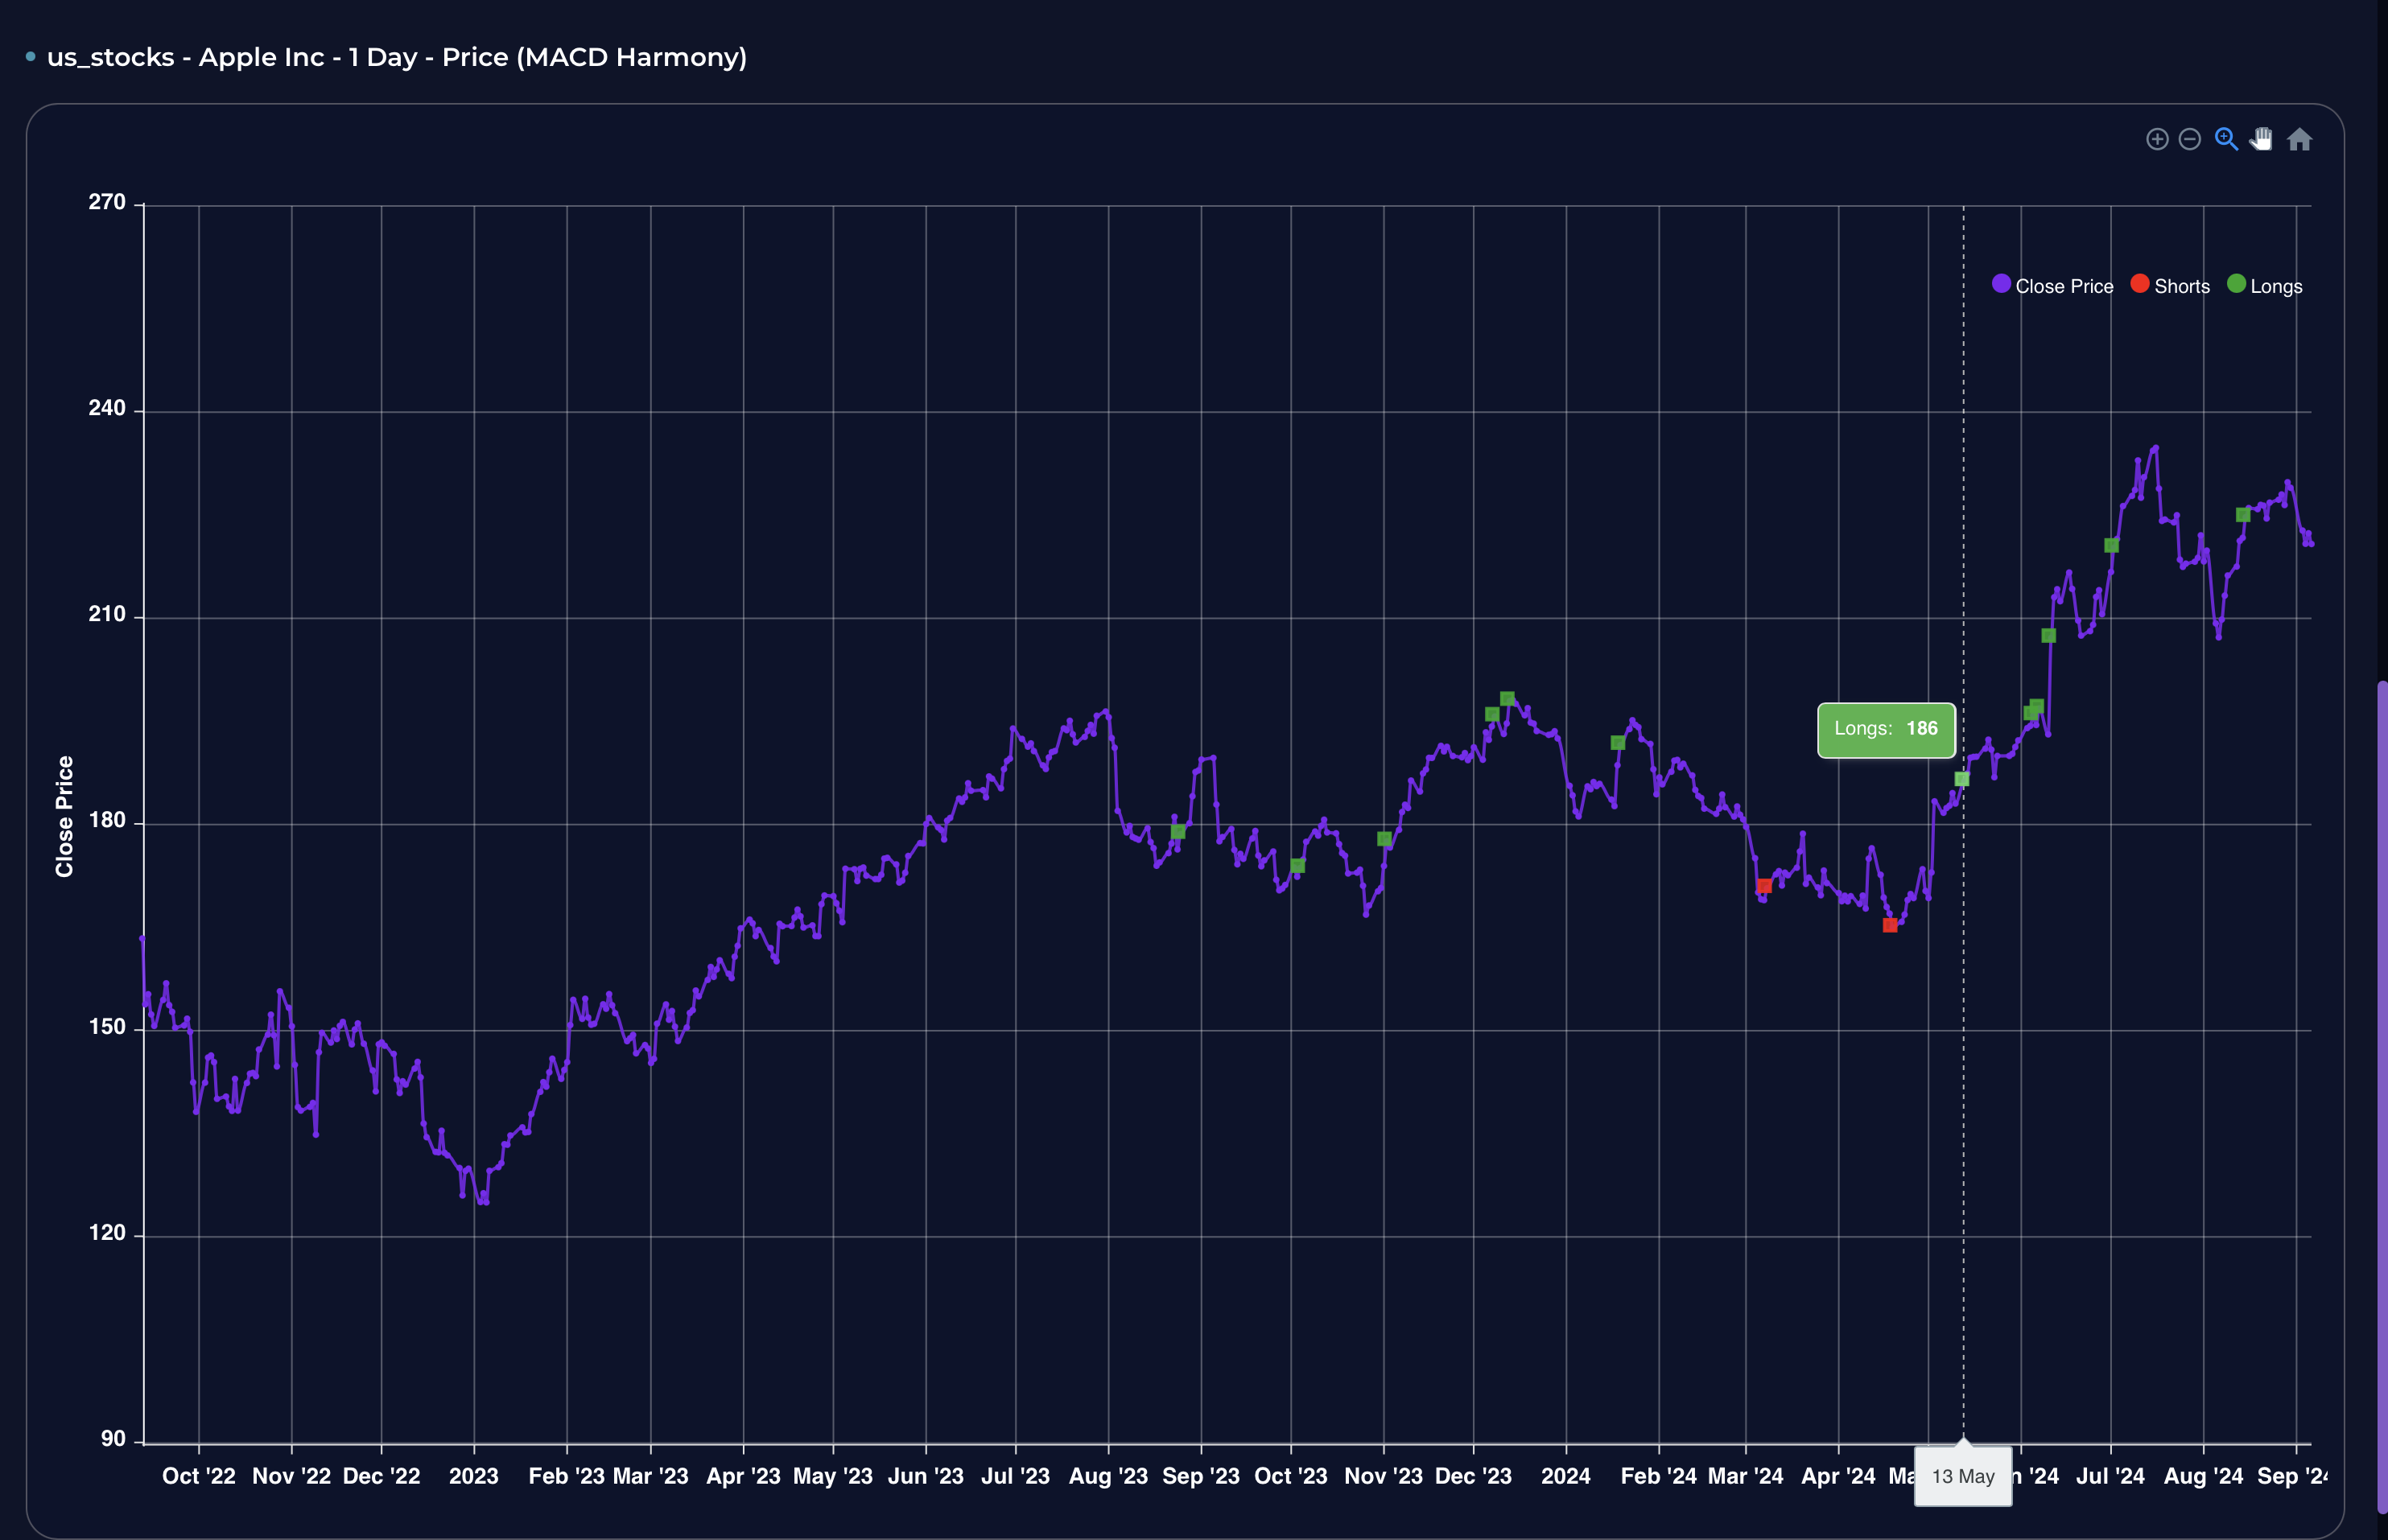
Show in Chart: This button displays the recent price history of the selected asset along with all triggered strategies. It provides a visual representation of:
Price movements over time
Entry and exit points for each active strategy
Go to Backtest: This button redirects you to the backtest page with all settings pre-configured from the current strategy. It provides:
Detailed analysis of the trading strategy
Comprehensive performance metrics
Historical performance data
Risk analysis and statistics
Tip
To visualize the signals generated by the strategy, you have the option to click on the “Show in Chart” button. This functionality allows you to view both the LONG and SHORT signals directly on the chart.
Tip
Use the “Go to Backtest” feature to perform a detailed analysis of any strategy that interests you. This will help you understand its historical performance and potential future behavior.
Tip
“N/A” in the table indicates that there is currently no active signal for the corresponding strategy (N/A: Not Available).
Chart#
The chart displays the closing prices of the selected asset at the chosen interval for the recent data points. Additionally, it offers the option to overlay the signals generated by the strategies onto the chart. This feature allows you to observe the relationship between the price movements and the signals provided by the strategies. By visualizing the data in this manner, you can gain valuable insights into the performance of the strategies and potentially identify patterns or trends that can inform your decision-making process.
See also
The live strategies chart specifically focuses on displaying the entry points of the strategies on the closing price chart within the recent data points. For a more comprehensive and detailed chart analysis, it is recommended to visit the backtest page.